Portfolio
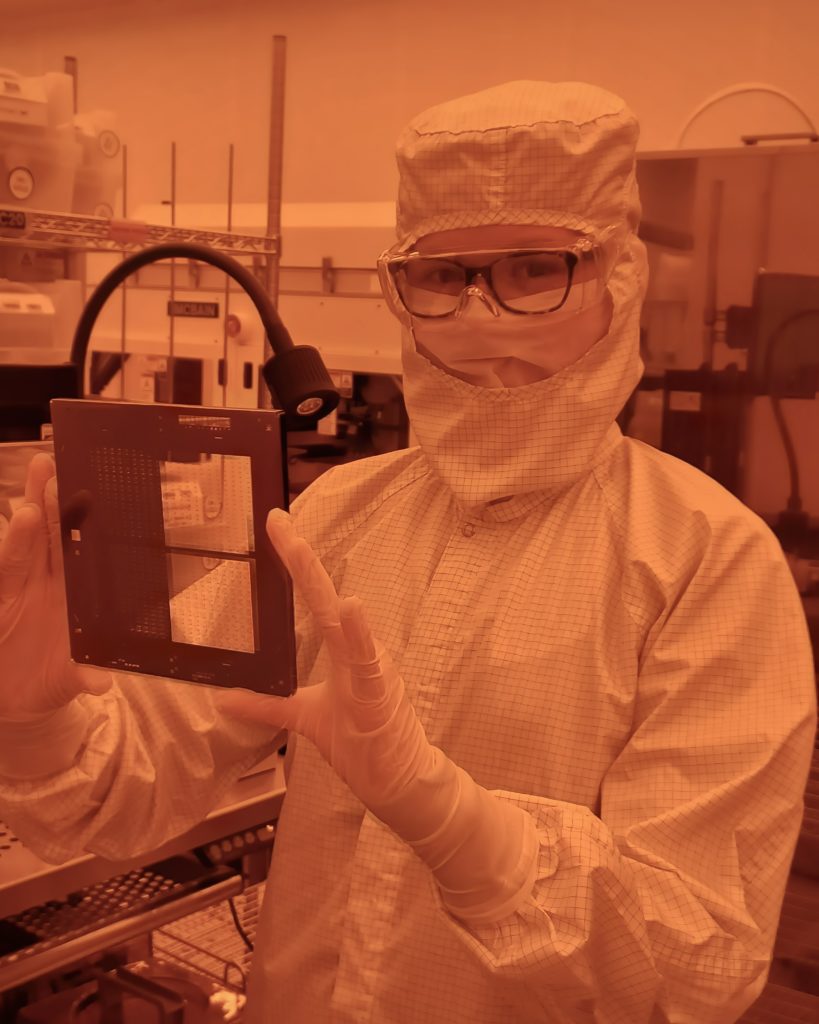
As a MEMS Process Intern, I developed GDSII photomasks to conduct critical dimension assessments on a new wet etching tool. These masks played a pivotal role in the acceptance test plan developed for the machine, ensuring that the etching resolution remained within 2-microns.
I carefully considered the selection of critical shapes within the masks to maximize the number of essential shapes tested while minimizing the die size. By incorporating these specific shapes, each dimension crucial to the overall performance of the wet etching process was tested. This approach validated the tool’s long-term capacity and sustainability.
The mask was designed in GDSII format using the CAD program KLayout. My design was etched onto a photomask via the removal of exposed quartz. I was the first to manipulate and conduct a lithography test on the ASML extreme ultraviolet system. Overall, the designed masks facilitated a comprehensive and targeted assessment, ensuring that the wet etching met the required quality standards.
As a motorsport fan and a car enthusiast, I wanted to gain a deeper understanding of the technical side of Formula 1. As I watched qualifying sessions or races, I often wondered: “What makes a particular driver quicker in a car compared to his teammate?” Disregarding variables such as weight or upgrade packages, it is clear that the split-second decisions made in a Formula 1 car’s cockpit can vastly influence its track performance.
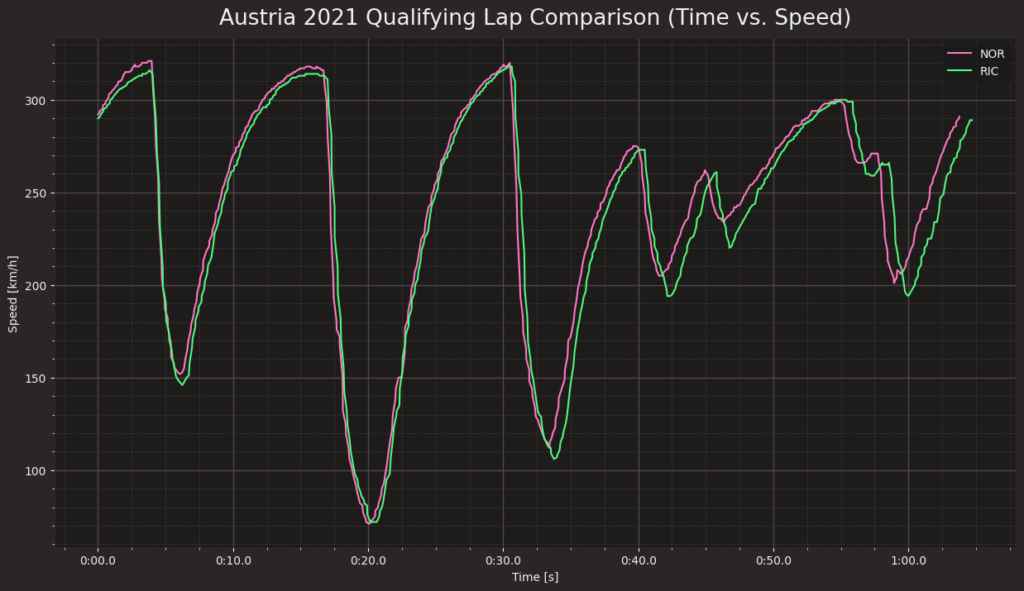
One of the most significant gaps in driver performance this year has been Daniel Ricciardo and Lando Norris of McLaren. Ricciardo has struggled in his car since he joined the team in 2021, having made only 14 Q3 appearances to Norris’ 21 and finished 45 points behind in the World Driver’s Championship. Many have stated that McLaren’s tricky car is to blame for his inconsistency or that he has lost the natural ability he possessed in his early career. I have analyzed both drivers’ styles intending to understand the reason’s behind Ricciardo’s poor run of form with the team. I have compared both drivers’ telemetry over several races in the 2021 season and have graphed their single-lap performance to visualise Ricciardo’s deficits. Lap data was extracted using the FastF1 Python API and graphed using the Python library Matplotlib.
For example, during the 2021 Austrian Grand Prix, Norris out-qualified Ricciardo by nearly three-tenths of a second. By examining the time versus speed graph, it is evident that Norris (pink) can carry a higher minimum speed through the corners (especially in the final sector of the track). He can then get on the throttle earlier, which saves him significant time during the lap. This graph shows that Ricciardo and Norris’ top straight-line speeds are similar. However, there is a considerable delta in their top cornering speed, with Ricciardo losing time to Norris in these areas.
As a final project component, MTE 201 (Experimental Measurement and Statistical Analysis) students were instructed to develop a measurement system. The device had to operate from first principles, be constructed based on fundamental theory, and not be adapted from a pre-existing sensor. Marks were based on a demonstration to the professor and a technical report detailing the design, calibration and uncertainty analysis required.
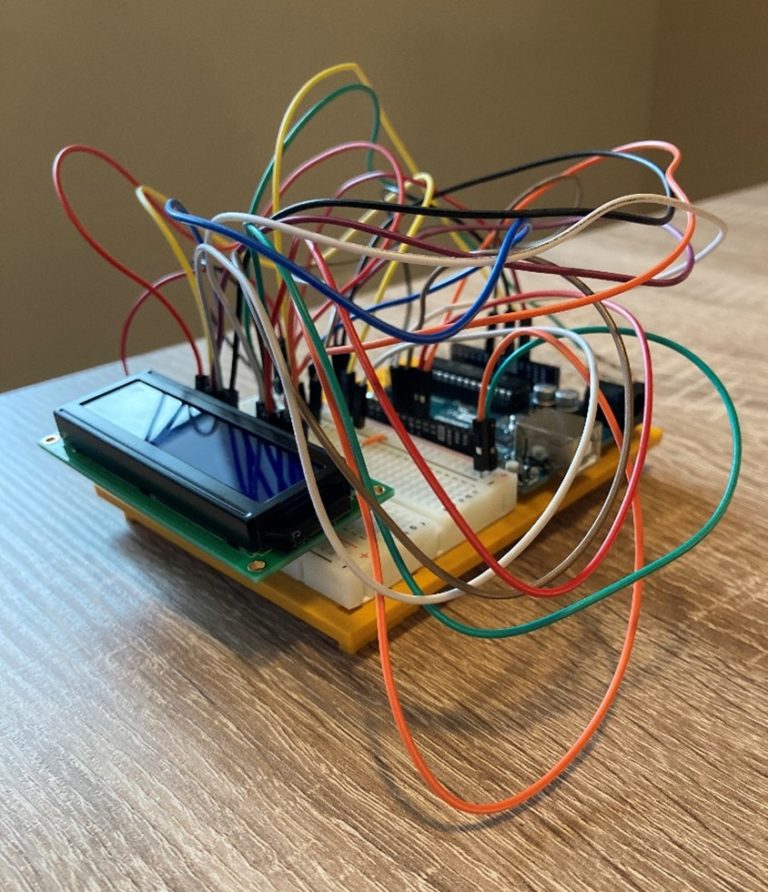
To measure the water temperature in a glass, I constructed a resistance temperature detector. The measurement system consists of two resistors in series, with an input voltage of 5 volts (V). An Arduino measures the voltage between the two resistors as an analog signal. The analog-to-digital converter (ADC) converts the signal to a 10-bit binary value (integer values of 0 to 1023). A small amount of code is used to convert the binary to voltage values. The device also includes a digital readout created using a liquid-crystal display (LCD). This addition displays temperature values directly from the system instead of the IDE’s serial monitor.
The measurement system is calibrated using a purchased thermistor. Again, the voltage between the thermistor and the last resistor is measured as an analog signal and converted to digital using the ADC. The measured temperature values are used as standard values for calibration. The calibration equation was established using the true temperature and the change in voltage measured by the voltage divider.

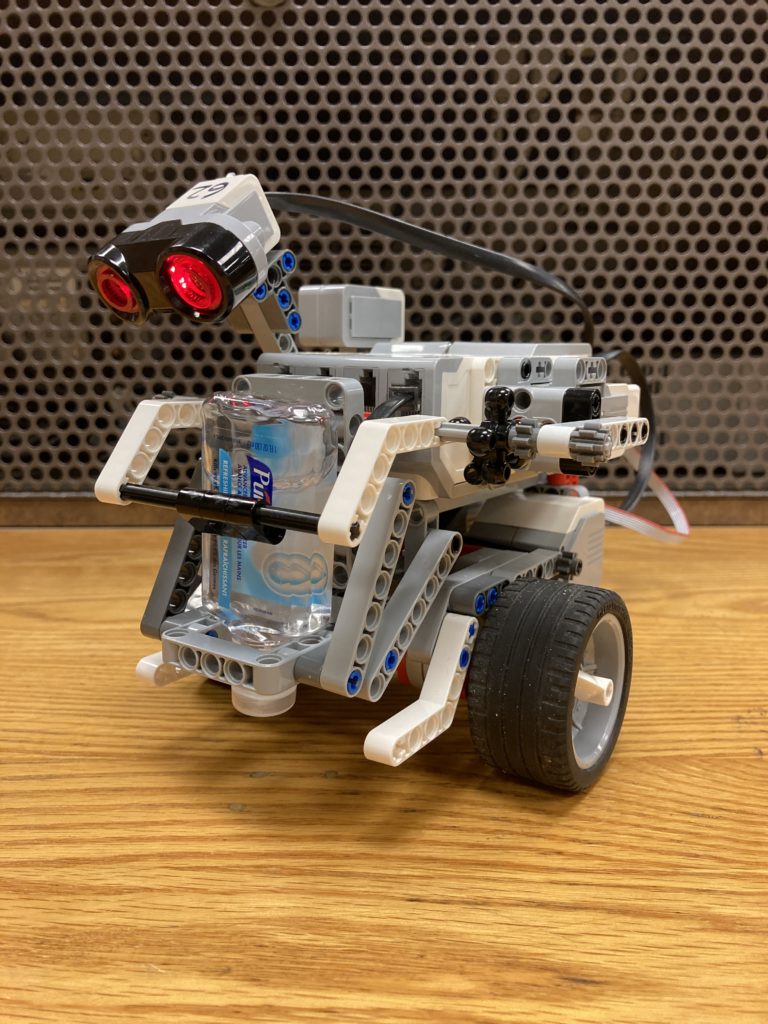
As a final component of the MTE 121 (Digital Computation) course requirements, students were asked to create a robot that would solve a real-world problem. Marks were based on software design, mechanical design, reflective report writing, and the successful completion of a demo. Each group of four students was permitted to use an EV3 Robot Kit along with any additional parts that were deemed necessary.
In response to the ongoing COVID-19 pandemic, washing our hands regularly to reduce the spread of viruses remained vital. This practice was essential when doing group work in class, as team members often come in contact with the same tools or objects. Yet, it was sometimes challenging for all group members to remember to sanitize their hands frequently. My team aimed to solve this problem by creating a robot that would remind a group of students to sanitize their hands during their time together.
As we planned out our solution to this problem, we divided our program into three main sections: the start-up, main, and shutdown procedures. During the start-up phase, the program configures all the sensors (gyro, ultrasonic) and sets the motor encoders to zero. The program then prompts for a number of group members and waits for the user to select a number using the Up and Down buttons. The program prompts again for a number of 30-minute increments and waits for the user to choose a time.
The program will then start the Main Procedures, which marks the start of the robot motion task. After 10 seconds have elapsed, a function is called to drive the robot forward 40 centimetres and stop. The function uses an empty while-loop to check whether an object is placed within 20 cm of its path. If this is true, the robot will stop moving as per the safety guidelines. After the sanitization is complete, another function is called to rotate the robot 180 degrees and return to its original position.
The dispensing task uses similar logic to the ultrasonic sensor implementation in the robot motion functions. Although, it uses a distance of 15 cm to determine if someone has approached their hand to sanitize. The program will activate the medium motor at a specified power and duration to squeeze the bottle if this is true. The sanitization process is repeated using a for-loop until the number of members entered at the program’s start has successfully sanitized their hands. After the sanitization is complete, the program instructs the robot to output a sound.
I designed and built a simple website to promote “Perspectives,” a dance showcase presented by CEAO Concentration Danse. I started by establishing a rough layout prototype on pen and paper. Then, using Figma’s design tools, I created an appealing website interface and evaluated the interface’s components to resolve design flaws and improve the user experience. Finally, I wrote the website’s markup (HTML) and style sheets (CSS). I have continued to update the interface as I expand my knowledge of UX Design and HTML/CSS.
Conveyor System Design
As a final component of the MTE 100 (Mechatronics Engineering) course, students were instructed to create a theoretical conveyor system. This project was conducted over four months, with each group of four students being evaluated on mechanical design, the choice of control and actuation components, system architecture, factory setup, software design, and cost estimation. Marks were based on the delivery of three live demos and the writing of four detailed technical reports.
The final conveyor belt needed to be able to sort two different types of boxes based on dimensions. The system had to have an initial section of at least 1.5 meters in length, moving the boxes forward before being sorted. There had to be two lines that separated the box types and had to move down the separate conveyors for at least 1.5m before they arrived at their respective sorting zones.
Each team member contributed significantly to the project’s research, design, report writing, and presentation. Specifically, each student analyzed datasheets to choose the best mechanical, actuation and control components per the client’s constraints and criteria. I selected the 1045 Carbon Steel Keyed Rotary Shaft (1497K975) from McMaster-Carr and the SX5-B6 Safety Laser Scanner from Banner Engineering.


